Crypto card spending hit a record $705.5M in July 2026
Based on verified official data as of 31.07.2026; hands-on update coming.
Crypto card spending reached a reported $705.5 million in July 2026 according to Paymentscan data circulated on 31 July, up 12.2% from June's $628.7 million and the fifth consecutive monthly record for the sector. The figure covers card transaction volume, not deposits or trading, and comes from a single third-party tracker rather than card issuers directly, so treat it as a directional trend signal, not audited totals. Rising volume does not change the fees you personally pay: network, conversion and ATM costs still decide your real spend.
TL;DR
- Paymentscan reports crypto card spending of $705.5M in July 2026, a 12.2% jump from June's $628.7M.
- July marks the fifth consecutive monthly record for crypto card transaction volume, per the same tracker.
- The number is aggregate spend across issuers, not deposits, top-ups or trading volume.
- The data comes from one third-party source (Paymentscan) and is not confirmed by card issuers or audited.
- Sector growth does not lower your personal fees: conversion (0-1%) and ATM (1.5-2%) costs are unchanged.
What the $705.5M figure actually measures
The headline is transaction volume: the total value of purchases and cash withdrawals made through crypto-linked debit and prepaid cards during July 2026. Paymentscan puts it at $705.5 million, a 12.2% rise over June's $628.7 million. That gap is roughly $77 million of extra monthly spend across the whole sector.
It is important to separate this from other numbers issuers like to promote. This is not deposits, not card top-ups, not trading turnover on the linked exchange, and not the number of cards issued. It is money that left a card at a point of sale or an ATM. A record here tells you people are spending more through cards, not necessarily that more people hold them.
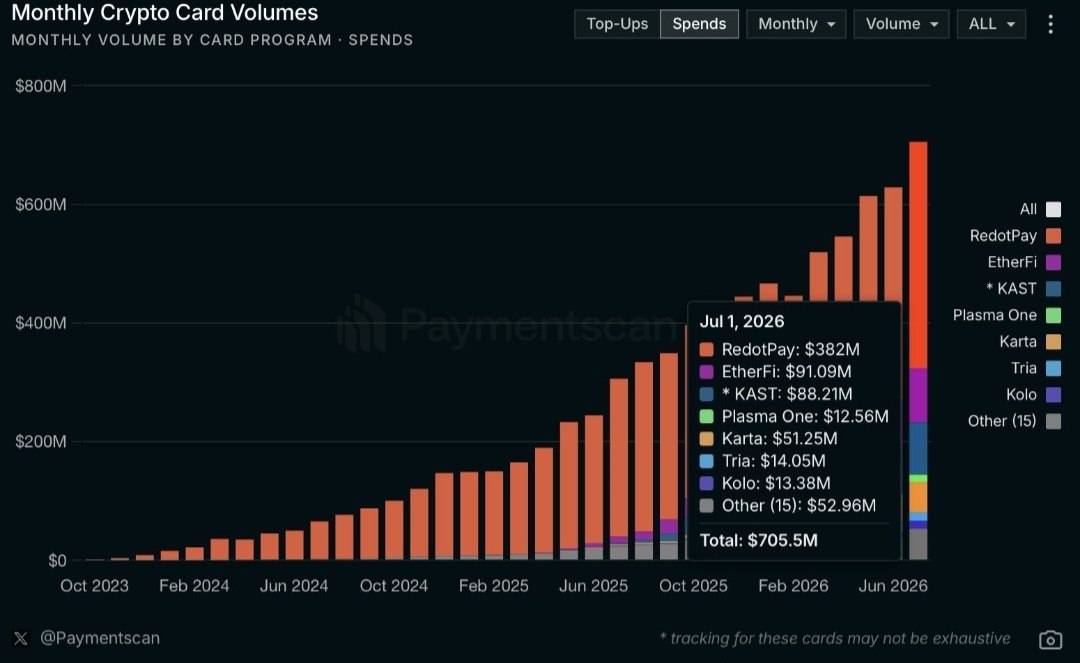
“💳 Расходы по криптокартам в июле достигли исторического максимума в $705,5 млн Это на 12,2% больше, чем в июне ($628,7 млн) и уже пятый подряд месячный максимум для сектора Данные Paymentscan ⭐️ - поддерживайте канал реакцией ✔️ - подпишитесь на Крипто Сливы”
Where the number comes from, and its limits
The figure originates from Paymentscan, a third-party payments tracker, and was circulated through a Telegram channel on 31 July 2026. No individual issuer has published matching totals, and there is no audited breakdown by card program, region or asset. Treat it as a directional indicator of sector momentum, not a verified accounting figure.
Third-party aggregate data carries known weaknesses: methodology is rarely public, coverage may exclude smaller or regional programs, and a single tracker can misclassify reloads as spend. Five straight monthly records is a genuine trend signal, but the exact dollar amount should carry an asterisk until an issuer or payment network confirms comparable numbers.
| Metric | June 2026 | July 2026 | Change |
|---|---|---|---|
| Reported card spend | $628.7M | $705.5M | +12.2% |
| Approx. absolute change | - | +$76.8M | - |
| Consecutive monthly records | 4th | 5th | +1 |
| Data source | Paymentscan | Paymentscan | Same tracker |
Why sector records do not cut your own costs
A record spending month is a market story, not a personal one. Your actual cost of using a crypto card is set by three things the aggregate number never touches: the conversion spread when crypto is sold to fiat (0-1% at the best cards in our database), any foreign transaction markup, and ATM withdrawal fees (typically 1.5-2% card-side plus the local operator charge).
Growth can even work against you if it comes with promotional cashback that later gets cut, or with cards funded on expensive networks. Before chasing a trending card, check the live conversion cost, the top-up network fee, and whether cashback is paid in a volatile token. Our fee tables and KYC friction ranking are built for exactly that comparison.
How to read growth headlines like this one
Consecutive records usually reflect a mix of real adoption, higher card usage per user, and stablecoin balances people prefer to spend rather than convert to a bank account. All three can be true at once. What the headline cannot tell you is churn: how many cards were abandoned in the same period.
For a YMYL decision, the practical takeaway is narrow. Sector momentum suggests more issuers competing for spend, which sometimes produces better cashback and lower fees. It never guarantees it. Judge any card on its published terms and your own monthly spend pattern, not on a market-wide record that includes millions of users nothing like you.
Risk warning: derivatives and crypto-backed credit involve significant risk, including liquidation of your collateral. Never commit funds you cannot afford to lose. Nothing on this page is financial, investment or tax advice.
Who this is NOT for
- Anyone wanting audited issuer figures - this is one third-party tracker's estimate.
- Cardholders looking for a specific card recommendation; this is a market-data explainer.
- Readers who need the regional or per-program breakdown, which was not published.
- People expecting sector growth to lower their personal conversion or ATM fees.
Frequently asked questions
It comes from Paymentscan, a third-party payments tracker, and was circulated on 31 July 2026. No individual card issuer has published matching totals, so it should be read as a trend indicator rather than an audited number.
NomadCrypto Editor
Editorial Team, NomadCard
The NomadCrypto editorial team verifies every published fee across 59 crypto cards against issuer documentation, with the verification date shown on every figure.