Bitcoin and the Next Crisis: What an 1875 Almanac, Google's Forecast Model and a Multi-Agent Simulation All Say (2026–2029)

The Benner cycle — a price-cycle table published in 1875 — marked 2026 as a “sell” year, and Bitcoin obliged: after peaking at $124,777 in October 2025 it trades near $66,000, down 47%. Both a statistical forecast (Google's TimesFM) and a multi-agent simulation point to a bottom between $49,000 and $58,000 in late 2026 or early 2027, a muted recovery through 2027, and a truncated cycle peak of roughly $159,000–$182,000 in 2029 — with wide error bars and no guarantees.
Updated October 2026
In 1875, an Ohio farmer named Samuel Benner published a chart of “future ups and downs in prices” — a repeating calendar of panic years, good times to sell, and hard times to buy. It was built for pig iron and corn. A century and a half later, I overlaid that table on Bitcoin's full price history, and the result was uncomfortable enough that I spent a week stress-testing it with two completely independent tools: TimesFM, Google Research's time-series foundation model, and MiroFish, a multi-agent market simulation with ETF institutions, leveraged corporate treasuries, miners, long-term holders, retail and a Fed agent all trading against each other.
This is the write-up of that experiment. It exists because the question I kept getting — “what happens to crypto if a real crisis hits?” — deserves a better answer than a hopium chart or a doom thread. Everything below is dated, sourced and reproducible: monthly BTC prices from blockchain.info, the almanac's actual 1875 grid, model outputs quoted with their uncertainty intervals, and simulation results labeled as simulation results. It is research, not investment advice — the limitations section near the end is as important as the headline numbers.
Where we stand as I write this, on July 22, 2026: Bitcoin trades at $65,950, down 47% from its all-time high of $124,777 set on October 7, 2025. The 2026 drawdown has already touched $58,534. The question is whether that was the bottom — or the rehearsal.
What is the Benner cycle?
The Benner cycle is a repeating price-cycle calendar published by Samuel Benner in his 1875 book Benner's Prophecies of Future Ups and Downs in Prices. It sorts years into three rows: A — panic years (financial crises), B — “good times, high prices” (the time to sell assets), and C — “hard times, low prices” (the time to buy). The rows repeat on fixed intervals — panics every 16–20 years, sell-years roughly every 8–10.
Benner built it from 19th-century commodity data — pig iron prices, corn, hogs — and offered no mechanism beyond the repetition itself. That should make it astrology for markets. And yet the table called the vicinity of 1929, the 1987 area, the dot-com top window and 2008 closely enough that traders keep passing it around 150 years later. Skepticism is the correct default: with intervals that wide, some hits are guaranteed. The interesting question is not whether the almanac is magic — it isn't — but whether its grid happens to line up with a real cycle in a specific asset. For Bitcoin, it currently does, and the alignment is tighter than it has any right to be.
The Benner grid, next 10 years
Per the original 1875 table: 2026 — B, “sell” year (the one we're in) → 2032 — C, cycle bottom, “buy” year → 2034 — B, next sell year → 2035 — A, panic year. Whether Bitcoin keeps obeying this grid is the whole question of this article.
The track record: five Benner marks, five Bitcoin hits
Since Bitcoin has had a liquid market, the Benner table has flagged five years. Here is what the asset actually did in each of them:
| Benner year | 1875 instruction | What Bitcoin did | Offset |
|---|---|---|---|
| 2012 — C | Buy — hard times, low prices | Accumulation at $4–15, then the 2013 rally (~×80) | Exact |
| 2016 — B | Sell — high prices | The cycle peak landed in December 2017 at $19,280 | +12 months |
| 2019 — A | Panic | Local top $12,933 in June 2019 → COVID crash of March 2020 (−60%) | +9 months |
| 2023 — C | Buy — hard times | Cycle bottom $15,760 in November 2022; all of 2023 was accumulation | −2 months |
| 2026 — B | Sell — high prices | Peak $124,777 on October 7, 2025; −47% by July 2026 | −3 months |
Five out of five marks worked within a ±12-month window — and the two most recent landed within a single quarter of the calendar year. The almanac told you to buy Bitcoin in 2023 (the bottom printed in November 2022, two months early) and to sell in 2026 (the top printed in October 2025, three months early). If you had done nothing else but follow a 150-year-old farm table, you would have caught the best entry and the best exit of the cycle.
Why a farm almanac “works” on Bitcoin — and when it will stop
There is no mystical force here, and it matters to say so plainly. Benner's sell-years repeat every 8–10 years. Bitcoin's dominant cycle — the halving, which cuts new supply in half — repeats every ~4 years. Two Bitcoin cycles therefore fit almost exactly inside one Benner interval: every second halving cycle lands on a Benner mark. The almanac isn't predicting Bitcoin; the two grids are temporarily in resonance, the way two turn signals blink in sync for a few beats.
That resonance has one more cycle of life in it. The grids stay aligned through the 2028 halving and the projected 2029 peak. After that they drift: Benner's next sell-year is 2034, while the halving arithmetic points to a peak around 2033. Somewhere past 2030, the almanac and the asset part ways — which is exactly what you'd expect from a coincidence of periods rather than a law. Until then, though, the overlay is a legitimately useful scaffold for scenario planning, because it agrees with the structural cycle that actually drives the asset.
The full picture: 14 years of BTC against the 1875 grid, plus a 36-month model forecast
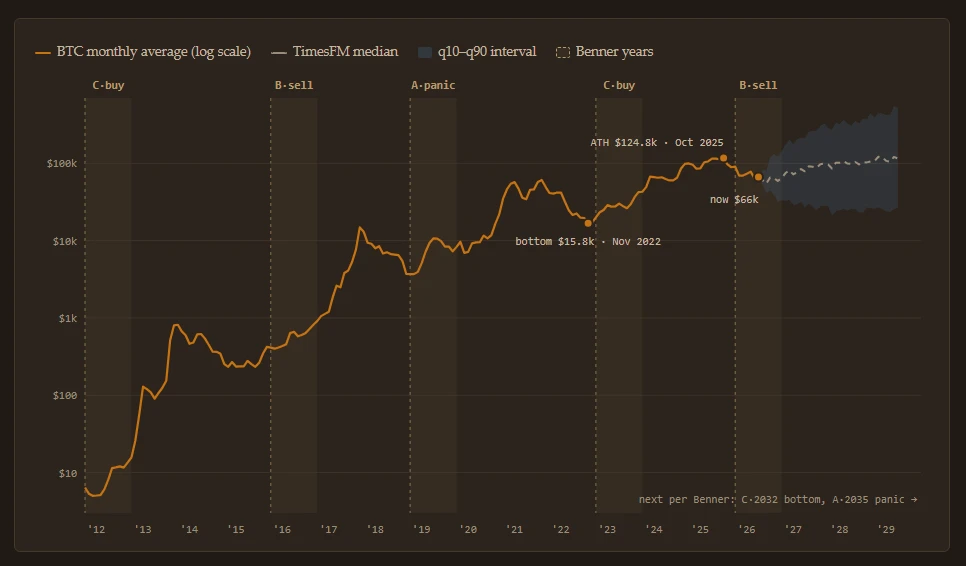
Read the shaded bands left to right and the story tells itself: accumulation in the 2012 band, a top a year after the 2016 band, a top-then-crash around the 2019 panic band, the bottom brushing the 2023 band, and the current drawdown inside the 2026 band. The gray fan is what a statistical model — with no knowledge of Benner, halvings or narratives — projects for the next 36 months.
What Google's TimesFM model forecasts
TimesFM 2.5 (google/timesfm-2.5-200m) is a time-series foundation model from Google Research — it forecasts numeric sequences the way a language model completes text, with no opinions about crypto. I fed it Bitcoin's monthly log-price series and asked for 36 months. Three things stand out in its output.
- The near-term path points down before up. The median trajectory dips through autumn 2026 — $54,479 for September — and ends the year at a median of $59,208 for December 2026.
- The uncertainty is enormous and honest. The 80% interval for December 2026 spans $32,000 to $122,000. Anyone selling you a single-number Bitcoin prediction is hiding this bar.
- The recovery shape matches the cycle. The median climbs back to roughly $99,000 by December 2027 and puts the cycle's high in 2029 — the same year the halving arithmetic and the Benner grid both point to.
A pure statistics engine, a 150-year-old table and the halving calendar independently sketching the same shape — down into late 2026, bottom, recovery through 2027, peak in 2029 — is the single most interesting result of this whole exercise. Agreement is not proof; three wrong models can agree. But disagreement would have killed the thesis, and there isn't any.
What the multi-agent simulation adds
Statistical forecasts can't tell you who sells to whom on the way down. For that I ran MiroFish — a multi-agent simulation (25 rounds, ~168 simulated hours) where ETF institutions, leveraged corporate treasuries, miners, long-term holders, retail traders and a Fed agent interact. The setup deliberately staged the conflict of the two cycles: Benner demands a slide toward 2032, the halving demands a 2029 peak. The simulation's verdict: the halving wins the timing, Benner wins the amplitude — the 2029 peak happens, but it comes in truncated.
| Phase | Simulation outcome |
|---|---|
| Q4 2026 | Miner capitulation: price breaks into the production-cost zone, anchored at $49,200 — the simulation's estimate of the post-2024-halving miner cost basis. High-cost miners sell; hashrate concentrates in large pools. |
| Q2 2027 | Final bottom: long-term holders and corporate treasuries absorb supply at $49–52k faster than miners and ETFs shed it; the turn is confirmed once the Fed starts cutting rates. |
| 2027 | A “political bull”: recovery to $58–76k, capped near $76k by long-term-holder profit-taking and debt-covenant stress at leveraged treasury companies (the simulation models their forced-selling threshold near $58k). |
| 2029 | A truncated peak of $159,000–$182,000 in the first half of 2029 — versus $250k+ from naive extrapolation of past cycles. After the peak, a long slide toward the Benner 2032 bottom. |
Honesty note on simulations
Multi-agent simulations generate plausible-looking micro-detail — specific order sizes, dates, percentages — that is invented. Only the structural conclusions that survived every round are quoted here, and they happen to agree numerically with the independent TimesFM forecast: bottom H2 2026–H1 2027, recovery to ~$99k by end-2027, cycle peak in 2029.
Three scenarios to July 2027
Synthesizing the almanac overlay, the TimesFM quantiles and the simulation gives three scenarios with rough probabilities. Treat the percentages as a structured way to hold uncertainty, not as odds handed down from anywhere authoritative.
| Scenario | Probability | BTC in July 2027 | What has to happen |
|---|---|---|---|
| Base — “bounce without euphoria” | 53% | $58,000–$80,000 | The bottom completes at $49–58k in autumn–winter 2026 (TimesFM's September median: $54.5k). The Fed's first cut flips ETF flows positive (+$320M/month in the simulation); 2027 recovers with a ceiling near $76k. |
| Bear — recession bites | 28% | $33,000–$52,000 | A hawkish Fed or a real recession breaks the ~$58k modeled treasury-stress threshold → margin calls → $52k breaks → the simulation's $49.2k miner anchor is tested. The TimesFM q10 tail allows $27–33k — an overshoot below “fair” bottom, like 2022. |
| Bull — the bottom is in | 19% | $97,000–$140,000 | July 1, 2026's $58,534 was the low. An early Fed pivot plus returning ETF inflows (>$1.8B/week into IBIT) break $84–88k, then $97k and a retest of the ATH. TimesFM's q75–q90 allows $140–213k — but Benner says “too early,” and the simulation gave this path less than a fifth. |
Will crypto survive a global recession? The honest version
This is the question people are actually asking, so here is the direct answer: Bitcoin is not a safe haven in the acute phase of a crisis, and pretending otherwise gets people hurt. In March 2020 — the last true global panic — Bitcoin fell about 60% peak-to-trough, faster than stocks, because in a liquidity crunch investors sell whatever still has a bid. The 2019 Benner “panic” mark caught exactly that sequence: a local top in June 2019, then the COVID crash nine months later.
What happened after March 2020 is the other half of the story: central banks flooded the system, and Bitcoin went from $4,830 to $67,562 in twenty months. That is the recurring crisis pattern for crypto — it trades as a risk asset during the panic and as a liquidity sponge during the rescue. A 2026–2027 recession would most likely replay it: the bear scenario above (a break of the ~$58k stress zone, a cascade toward the modeled $49k miner-cost anchor, a tail to $33–40k) is the panic phase; the Fed's response is the fuel for whatever comes next.
Structurally, this cycle has one new stabilizer and one new fragility. The stabilizer: spot-ETF holders and corporate treasuries are slower, stickier money than 2018's retail leverage — in the simulation they are precisely who absorbs the bottom. The fragility: leveraged treasuries carry debt covenants, and the simulation models their forced-selling threshold near $58k — below it they flip into forced sellers, a reflexive mechanism that did not exist in previous cycles. The exact level is a model estimate, not a disclosed covenant; the mechanism is the point. A recession that pushes price through that zone converts the strongest hands of the bull market into the loudest sellers of the bear.
And to complete the honesty: if your concern is spending money next month rather than a portfolio in 2029, price forecasts are the wrong tool entirely. Money you plan to actually use in a crisis belongs in stablecoins, not in an asset with a live 28% scenario of visiting $33k. That boundary — volatile assets for conviction, stable assets for life — matters more than any cycle chart in this article.
Buy now, DCA, or wait? What the models say — not what you should do
I asked both engines one narrow question: for a buyer with a 2–4 year horizon and a fixed budget, which entry pattern historically-plausibly accumulates the most BTC from here ($66k)? The simulation put the probability of a retest below $58k before July 2027 at 81%, and the chance price runs above $84k without any retest at 19%. Under those odds, four strategies shake out like this:
| Strategy | BTC per $100k (expected value) | Worst-case regret |
|---|---|---|
| A — lump sum now at $66k | 1.516 | −20.2% |
| B — DCA over 9 months | 1.576 — best expected value | −21.8% |
| C — wait for the $49–58k ladder | 1.479 — worst expected value | −48.5% if price runs away (avg entry $128k in the bull branch) |
| D — hybrid: 40% now, 30% DCA, 30% reserved for the $49–52k zone | 1.528 | −18.3% — smallest maximum regret |
Both engines agreed on the shape: the pure edges lose. All-in-now is dominated by the hybrid almost everywhere; pure waiting has the worst expected value and is catastrophic in the branch where price simply leaves. Spreading entries wins on expectation; keeping a reserve for the capitulation zone wins on regret. This is a description of model output under stated assumptions — your taxes, income, jurisdiction and risk tolerance are not in the model, which is one of several reasons this is not a recommendation.
Six triggers that decide which scenario is unfolding
- Spot-ETF flows (daily, public). June 2026 was the worst month in ETF history at −$4.5 billion. Four-plus consecutive weeks of inflows is the first sign of the base scenario; two straight months of IBIT outflows marks the bear.
- The Fed's July 28–29, 2026 meeting. Hot inflation or a hint of a hike risks an immediate break of the ~$58k zone. The first rate cut is the main 2027 reversal trigger in both models.
- The ~$58,000 zone. The simulation's estimate of where leveraged treasury companies' debt covenants would force selling — a model number (plausibly anchored on July's real $58,534 low), not a disclosed covenant. A clean break would open the cascade to $52k → $49k.
- Miner capitulation signatures. Rising fees on a falling hashrate, 10+ consecutive days of miner-reserve outflows — historically the final phase of a bottom (2018, 2022). The simulation schedules it for Q4 2026.
- The $49,000–49,500 zone. The simulation's estimate of post-2024-halving production cost and its bottom anchor. A monthly close below it signals the bear tail ($33–40k).
- The Benner grid ahead. Cycle bottom C-2032, panic A-2035. If the halving resonance survives to 2029, that peak is the last “easy” one before the two grids diverge.
Method, sources and the limitations that matter
Read this before acting on anything above
Historical prices: blockchain.info monthly averages, 2010–2026. Forecast: TimesFM 2.5 (200M, Google Research), zero-shot on the log series, 36 months — its quantiles are an uncertainty estimate, not a promise. Scenarios and probabilities: a synthesis of the MiroFish multi-agent simulation, the TimesFM output and the cycle overlay. The Benner cycle is an empirical 1875 table with no physical mechanism; its Bitcoin “accuracy” is largely resonance with the halving cycle and can stop at any time. This is research material, not individual investment advice — the author is not a licensed adviser, cryptocurrency is a high-risk asset, and the market is entirely capable of zeroing out every scenario on this page.
If you live on crypto, the cycle is a cash-flow problem
One practical footnote from the team that spends most of its time auditing crypto card fees rather than forecasting cycles. A −47% drawdown changes daily life twice: your balance is worth less, and every conversion fee hurts double — the roughly 2% (~€20) average cost per €1,000 spent abroad that we measure across all 59 tracked cards is the same percentage of a much thinner cushion. Bear markets are exactly when fee discipline and a stablecoin spending buffer stop being optimizations and start being survival. If part of your income or savings moves through crypto rails, that setup matters in every scenario above:
Low-fee cards for spending stablecoins through the cycle





See what every card really costs
Our live audit of 59 cards: the average one costs about 2% (≈€20) per €1,000 spent abroad — and 4 of 59 don't publish their conversion fee at all.
Frequently asked questions
A repeating price-cycle calendar published by Ohio farmer Samuel Benner in 1875, sorting years into panics (A), good times to sell (B) and hard times to buy (C) on fixed 8–20 year intervals. It was built from 19th-century commodity prices and has no physical mechanism — yet its marks have landed near several major market turns, including Bitcoin's 2022 bottom and 2025 top.