Monthly crypto-card transaction volume reportedly climbed more than 500% from September 2024 to about $600 million, with Visa handling roughly 90% of that volume, which is the clearest sign that Crypto Debit Card Cashback is no longer a niche perk but a payments feature with real adoption pressure. The catch is that the advertised percentage is usually the least interesting part of the product. The number on the landing page tells you almost nothing until you subtract fees, spreads, caps, staking requirements, and tax friction.
Table of Contents
- The Headline Rate Is Not Your Real Cashback
- How a Crypto Card Cashback Transaction Actually Works
- What Funds the Cashback Issuers Pay You
- Stablecoin Versus Volatile Token Cashback
- KYC, Region, and Custody as Cashback Filters
- Why a Lower Headline Rate Can Pay More
- Comparing Real Programs on Effective Cashback
- Maximizing Your Own Crypto Debit Card Cashback
The Headline Rate Is Not Your Real Cashback
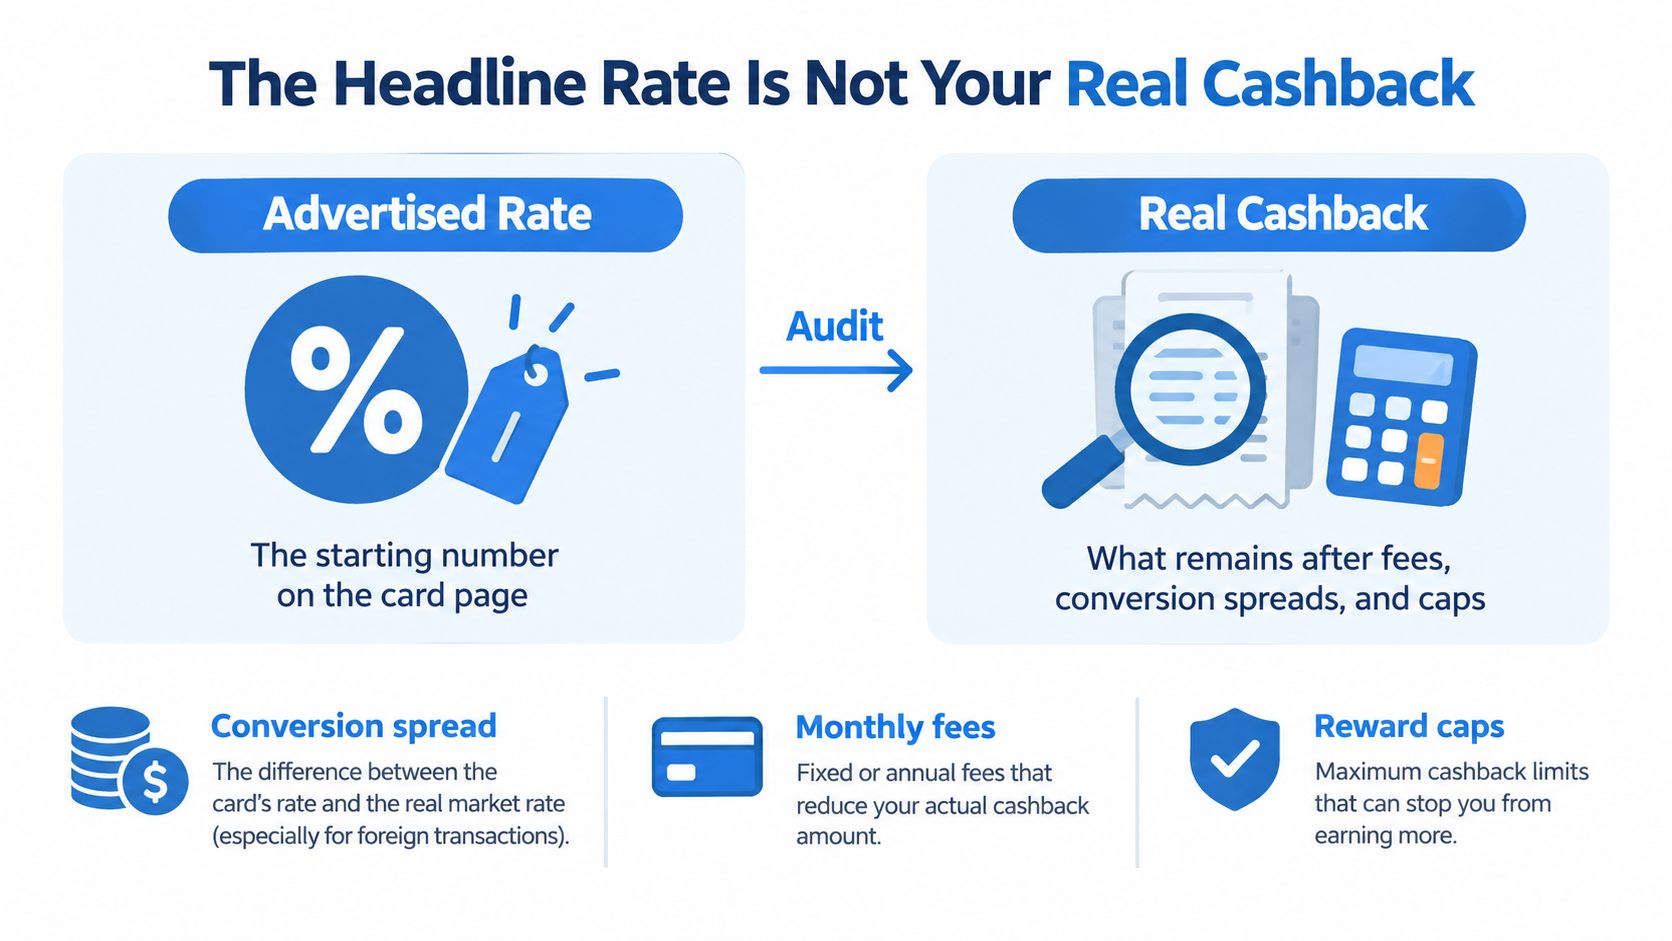
Most market descriptions put base-tier crypto debit card rewards around 1% to 2%, while higher tiers can reach 3% to 10% when staking, subscription status, or token holdings access the top band. Conventional bank-card cashback usually sits near 1% to 2%, so the headline gap looks dramatic only until you inspect the conditions attached to the reward crypto-card cashback overview. The point is not that crypto cards are always worse or always better, it's that the advertised rate is only the first line in the audit.
Why the banner number misleads
A 5% reward can be weaker than a 1% reward if the 5% is paid in a token that falls before you use it, sell it, or move it. Reward caps and excluded merchant categories shrink the realized rate, and the same is true for settlement timing, because instant credit feels better than a monthly posting only if the asset you receive holds value until redemption. The user who stops at the headline rate misses the underlying economics.
Practical rule: treat every cashback banner as a draft term sheet, not a final return figure.
There's also a structural split between rewards paid in a stable asset and rewards paid in a volatile native token. A stablecoin-denominated reward is easier to value, while a token reward can look generous on day one and weak by the time it's spent. That's why a serious comparison starts with the advertised percentage and ends with the realized value after conversion, fees, and limits.
Why cashback deserves a full value check
How a Crypto Card Cashback Transaction Actually Works
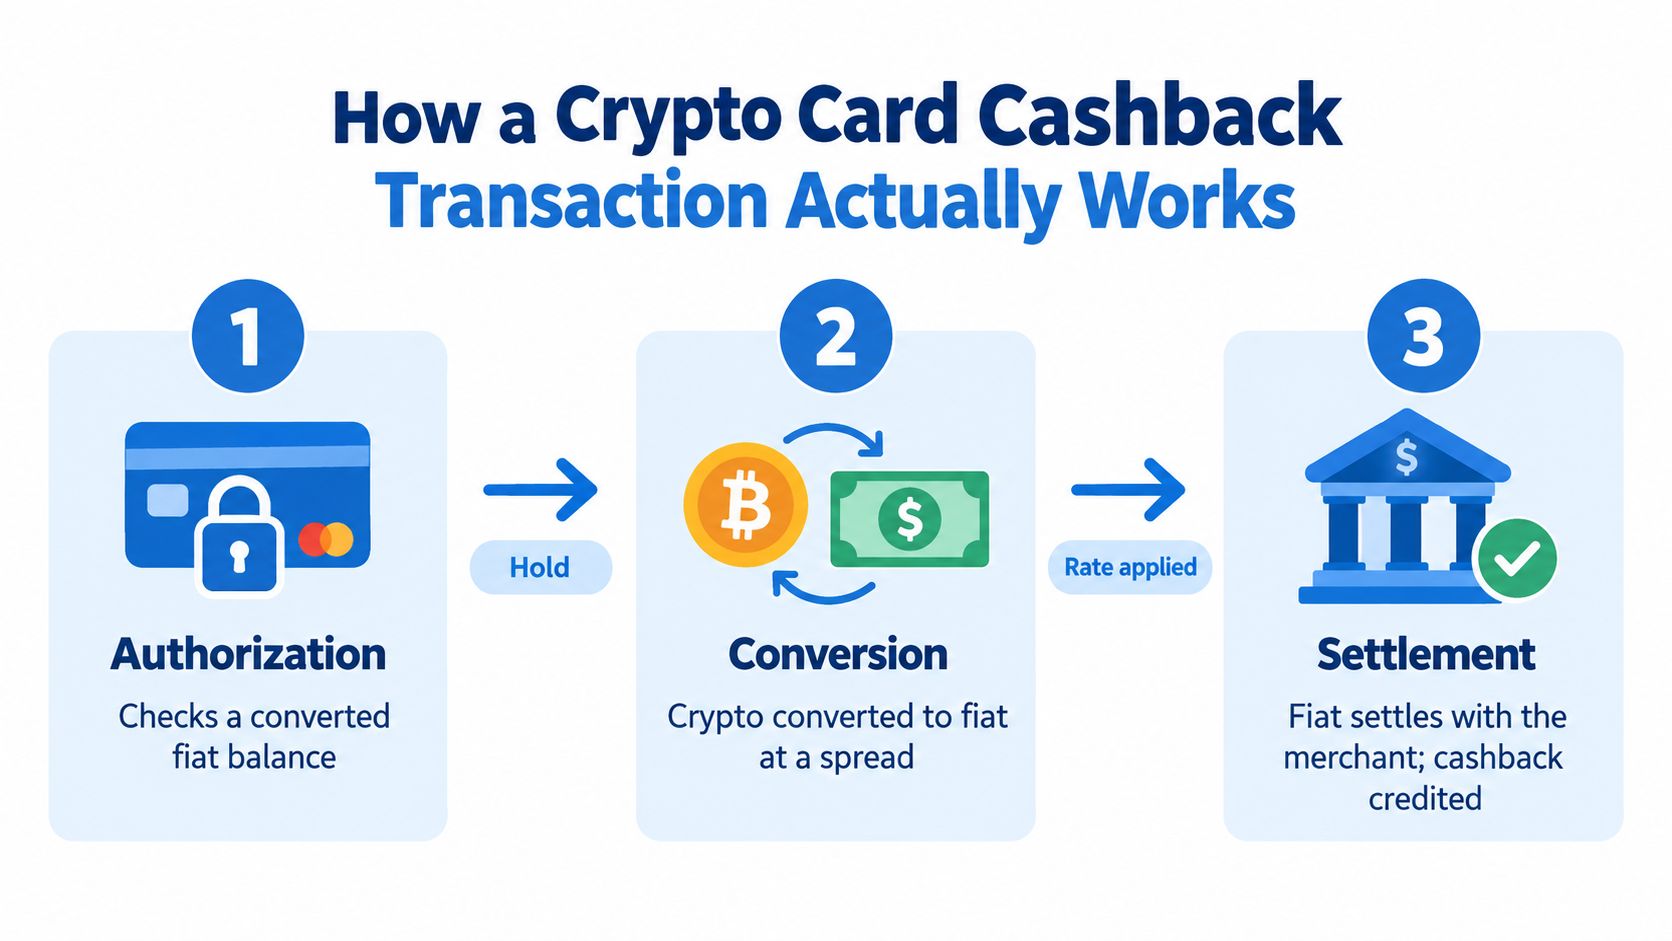
A swipe on a crypto debit card usually involves three different actions, even if the app makes it look instant. First, the card network authorizes the purchase against a converted fiat balance. Second, the issuer settles with the merchant in fiat. Third, the user receives cashback in crypto, stablecoins, or points, depending on the program.
The reward is not the transaction
That separation matters because the reward can arrive instantly, monthly, or only after a minimum threshold. Some programs credit rewards right away, others post them later, and some impose expiry rules or redemption thresholds that make small balances annoying to use. Cashback also isn't the same thing as a sign-up bonus or a merchant-funded statement credit, even when the app groups them together in one interface.
The asset type changes the user experience too. A reward paid in a stablecoin behaves like a predictable rebate, while a reward paid in a native token is a second market exposure layered on top of the original spend. If the card forces the user to hold that reward until a vesting schedule clears, the value can drift before it ever becomes usable.
Cashback is only “cashback” if you can value it cleanly, access it cleanly, and spend or sell it without extra friction.
The cleanest way to think about the flow is simple. The user spends fiat-like value at the merchant, the issuer handles conversion and settlement behind the scenes, and the reward arrives separately under its own rules. Once you split those legs apart, the marketing language gets much easier to audit.
How to compare stablecoin-funded spending with card rewards
What Funds the Cashback Issuers Pay You
The issuer can't pay a reward out of thin air. In the European Economic Area, Regulation (EU) 2015/751 caps consumer debit-card interchange at 0.2% of transaction value and consumer credit-card interchange at 0.3% EU card fees summary. On a €100 eligible debit purchase, the regulated interchange ceiling is €0.20 before network, processing, compliance, fraud, servicing, and rewards costs even enter the picture.
Why high rewards need another funding source
That's why a program advertising 1% cashback can't sustainably fund the reward from EEA debit interchange alone. It has to lean on something else, such as subscription fees, foreign-exchange or conversion spreads, merchant-funded incentives, lending revenue, cross-subsidization, or a token budget. The same economic logic applies in the United States, where debit interchange limits also constrain what ordinary spend can fund.
A useful comparison rule follows from that structure. Normalize cashback by region, card type, and funding source, then subtract annual fees, FX markup, crypto conversion spread, and withdrawal costs before you call the reward “good.” A card with a higher sticker rate but a heavier fee stack often ends up weaker than a lower rate with cleaner economics.
If the reward exceeds the issuer's plausible payment revenue per dollar of spend, something else is subsidizing the gap.
That “something else” is not automatically bad, but it changes the risk profile. A token-funded program can be promotional, a subscription-funded program can be durable, and a merchant-subsidized offer can be narrow by category or geography. The only honest comparison is the one that traces the money path from merchant payment to issuer revenue to user reward.
Stablecoin Versus Volatile Token Cashback
A 2% reward in a stablecoin and a 5% reward in a volatile native token do not deliver the same realized value. The token reward starts with a higher headline rate, but its value can fall before redemption, so the amount the user ultimately keeps may be lower than the sticker suggests.
Comparison of reward assets
| Reward Asset | Headline Rate | Assumed Price Move | Conversion Spread | Effective Rate |
|---|---|---|---|---|
| Stablecoin | 2% | 0% | 0.5% | 1.5% |
| Native token | 5% | -20% before redemption | 1.5% | 2.5% |
That table is the right way to compare programs because it forces the reward into the same unit you spend. A stablecoin-paid reward usually gives you a tighter range around the quoted rate, while a native-token reward can look richer on paper and still deliver less after price movement and conversion costs. The headline alone does not tell you which card pays more.
Custodial card programs usually convert the user's crypto at the issuer's quoted rate, and that quote can sit away from spot. A stablecoin-funded card, such as a setup covered in How to compare stablecoin-funded spending with card rewards, shifts some of that volatility away from the reward leg and into the funding step. The cost does not disappear, it shows up in a different place.
For users who want to stress-test token exposure, the guide to crypto drawdown control is more useful than another yield pitch. The same logic applies here. The question is not just how high the rate looks, but how much survives conversion, market movement, and redemption.
The hidden fee in the spread
Conversion spread is the quiet cost in many card programs. If the issuer's internal rate is weaker than spot, the user gives up value before cashback even lands. When the reward is also paid in a volatile asset, value can leak twice, once at spend and again at redemption.
How reward denomination changes the value of a card
KYC, Region, and Custody as Cashback Filters
Not every user can access every reward tier, and that's where many comparisons fall apart. Some cards sit in a No KYC or email-only bucket with tight limits, while others require full identity checks before any meaningful cashback tier opens up. Region also matters, because availability can change what reward rates a user can access.
Access comes before optimization
Custody makes the filter even stricter. In a custodial setup, the issuer holds the underlying crypto and decides how the reward is funded and credited. In a self-custodial or non-custodial setup, the user controls the wallet or signing environment, which changes both the compliance path and the operational trade-offs.
That's also where regulatory work comes in. Programs that operate across borders need to map licenses, regional restrictions, and product design carefully, which is why some teams bring in specialists such as choosing regulatory compliance consultants before they launch or expand a card. The practical effect for users is simple, if the card isn't available in your region or your KYC tier, the quoted cashback rate is irrelevant.
The shortlist should be eligibility first
Before comparing percentages, filter by the following:
- Region availability. If the issuer doesn't serve your country, the reward never becomes usable.
- KYC level. No KYC, email-only, and full KYC programs behave very differently on limits and tier access.
- Custody model. Custodial and self-custodial cards expose users to different trade-offs in control, compliance, and support.
- Reward gating. Some tiers depend on a balance, a token holding, or staking, so the top rate may never be reachable for a normal user.
How KYC levels shape card access
Why a Lower Headline Rate Can Pay More
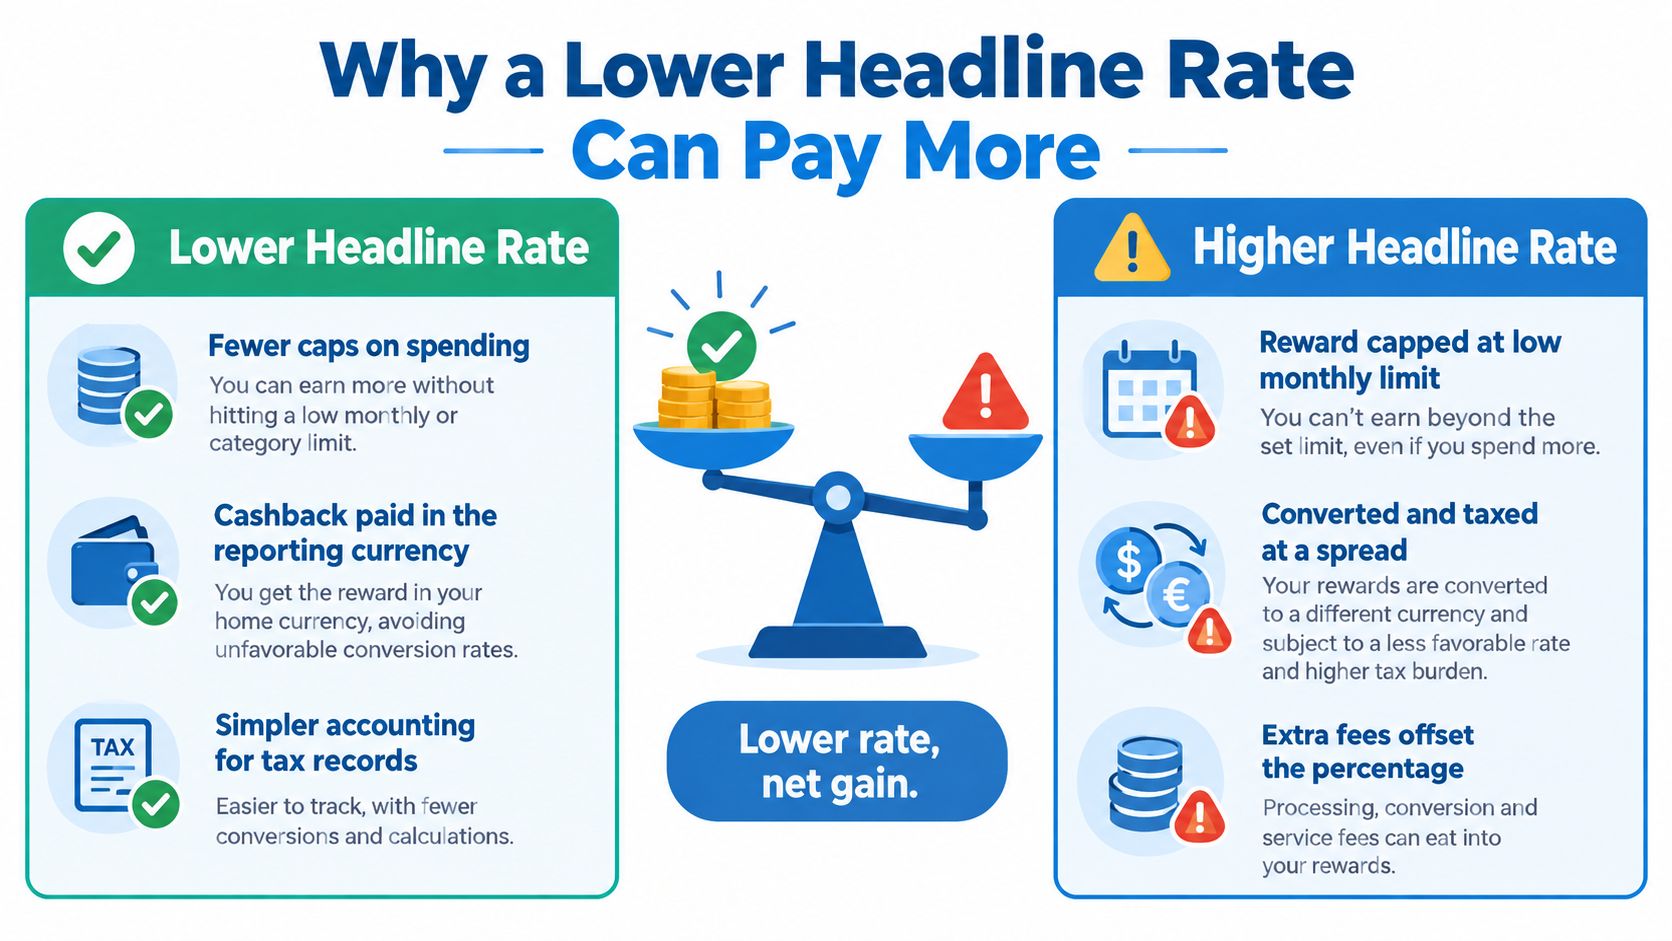
A higher rate can still leave you with less usable value. The U.S. Internal Revenue Service states that digital-asset transactions must be reported whether they produce a taxable gain or loss IRS digital-asset reporting guidance. In practice, a card purchase can create one taxable event when crypto is sold or transferred to settle the payment, and a second event when cashback is credited back to the user.
The accounting burden changes the net return
A 3% reward can deliver less usable value than a 1% fiat rebate once basis tracking, small gains or losses, and recordkeeping overhead are added in. For example, a 3% token reward on €12,000 of annual spend is €360 nominal, but if the token drifts 10% before disposal and the gain is taxed at 25%, the tax on that drift alone is €9. That still leaves the user with more gross reward than a 1% cash rebate, but the comparison starts to compress once you add repeated tracking across many purchases and the time spent reconciling each lot.
Finland's tax authority also states that crypto credited as cashback can be taxable capital income at market value when received, while spend-based cashback may be tax-exempt in some cases where users are not required to stake or lock assets Finnish Tax Administration on cashback rewards. Those are different treatments, and the difference matters as much as the headline rate.
The cleanest reward is often the one that does not create a second tax problem.
That is the practical takeaway. A lower headline rate can be better on a net basis if it behaves like a simple rebate, while a higher token reward can add a valuation task and a reporting obligation on top of the original spend. Users who ignore that split often overrate the banner percentage and underrate the compliance cost.
A simple decision frame
Separate the events before comparing offers. First, earning the cashback. Second, converting it or spending it. Third, tracking what the tax authority treats as income, rebate, or disposal. Once those steps are separated, the strongest offer is often the one with less paperwork and fewer market-moving assets sitting in the reward wallet.
Comparing Real Programs on Effective Cashback
A useful comparison does not start with the biggest percentage. It starts with the reward asset, the fee stack, the custody posture, and the KYC friction, then asks what the user keeps after the program takes its slice. That is why a high advertised rate can shrink quickly once conversion costs and required staking are added back in.
A side-by-side comparison lens
| Card Program | Headline Cashback | Reward Asset | Annual Fee | FX / Conversion Cost | Effective Cashback |
|---|---|---|---|---|---|
| Crypto.com Visa | Tiered, tied to staking | CRO | Free base tier, paid tiers available | FX fees vary by region | On a $1,000 monthly spend in a typical card region, a 2% headline can fall to roughly 1% after a 1% conversion drag, before any CRO price change |
| Nexo Card | Cashback plus idle-balance earn | Platform-linked reward structure | No annual fee | Borrowing and spread economics apply | On the same $1,000 monthly spend, a headline cashback offer can land closer to the low end once balance requirements and spread are counted |
| Bybit Card | Cashback plus Auto-Earn | Crypto-linked reward | No annual fee | Conversion economics can apply | On the same $1,000 monthly spend, the realized return depends on how much value is lost when assets are funded and converted |
| ether.fi Cash | Cashback plus vault yield | Stable-value and yield-linked structure | No annual fee | Borrowing or vault routing affects cost | On the same $1,000 monthly spend, the effective rate changes with the cost of collateral setup and the path used to fund the card |
The point of a table like this is not to crown a winner. It is to show that “cashback” is only one layer in the product, and sometimes not the dominant one. A card with less flashy rewards can be stronger on net terms if it avoids subscription drag, expensive spread, or rigid staking gates.
NomadCards aggregates these variables into standardized card profiles, so the reward rate sits next to fees, supported assets, regional availability, and custody model instead of floating alone as a marketing number. That is the right unit of comparison if the goal is retained value, not just a bigger banner.
Maximizing Your Own Crypto Debit Card Cashback
The formula is straightforward once you strip away the marketing. Start with the headline rate, then subtract conversion spread, FX markup, ATM or withdrawal fees, annual or subscription fees, and the value of any required staking or locked balance. After that, adjust for tax treatment and reward caps, because a capped 10% offer can be weaker than an uncapped 1% rebate if you spend enough volume.
A reusable checklist
- Filter by eligibility first. Region, KYC level, and custody model decide what you can use.
- Check the funding source. Interchange-funded, subscription-funded, and token-subsidized programs don't behave the same way.
- Inspect the reward asset. Stablecoin or fiat-like credit is easier to value than a volatile native token.
- Read the fee stack. Annual fees, FX markup, and conversion spreads often do more damage than the difference between two headline rates.
- Account for taxes. If cashback triggers reporting or disposal events, the after-tax return changes fast.
The sustainable base rate for an ordinary user matters more than the promotional maximum. If the card only works when you stake assets, hold a token, or accept a wide spread, the reward is paying you back with one hand and charging you with the other. If you care about cashback, privacy, or spending without selling, compare the effective rate on your own spending pattern, not the issuer's top-tier marketing number.
NomadCards organizes crypto card data into filters, profiles, and comparison tools that make this kind of audit faster. If you want to compare cashback, fees, custody model, KYC requirements, and regional availability in one place, visit NomadCards and run the numbers against your own spending profile.