Most advice about bitcoin leverage trading starts with the leverage multiplier and ends with a warning to “manage risk.” That framing misses the danger. Leverage doesn't simply make a trade move faster. It places your position inside a mechanical system where maintenance margin, mark prices, funding transfers, order-book liquidity, and other traders' forced exits interact in real time.
A margin long can be directionally correct and still lose money because funding keeps draining the position. A modest spot decline can become a much larger derivatives selloff when liquidations create additional market selling. The relevant question isn't only whether Bitcoin will rise or fall. It's whether your collateral can survive the path the market takes before your thesis has time to work.
Table of Contents
- The Reality of Bitcoin Leverage Trading
- Core Mechanics of Perpetual Futures and Margin
- The Nonlinear Math of Forced Liquidations
- Funding Rates as a Live Market Signal
- Anatomy of a Liquidation Cascade
- The Structural Shift in Crypto Derivatives
- Defensive Risk Management and Position Sizing
The Reality of Bitcoin Leverage Trading
The popular mental model treats magnified exposure as a volume knob. At low magnification, you supposedly make a small profit; at high magnification, you supposedly make a large profit. In practice, magnified exposure changes the distance between your entry and the exchange's liquidation threshold, while exposing you to costs and market mechanics that don't appear in a simple profit calculation.
Perpetual futures are financed positions, not ordinary Bitcoin holdings. You post collateral, control a larger notional exposure, exchange funding payments with the opposite side, and remain subject to continuous mark-to-market accounting. The exchange doesn't wait for your personal view to be disproved. It closes the position when the account no longer satisfies its maintenance requirements.
That distinction matters because liquidation isn't the same as losing your initial margin. Your position can be closed before the underlying Bitcoin move looks dramatic on a spot chart, particularly when the borrowed amount is high and fees, funding, spread, and slippage consume part of the available buffer. A practical explanation of how margin calls work is useful here because the trigger depends on collateral requirements, not on the emotional conviction behind the trade.
Practical rule: Treat your liquidation price as an emergency boundary, not as a planned stop-loss.
The market's collective positioning adds another layer. If many traders hold crowded longs, their liquidation levels can sit in nearby price ranges. Once the first positions close, the forced selling can push the market into the next group of thresholds. That feedback loop is why a normal move in spot can produce an abnormal move in perpetuals.
This also changes how volatility should be interpreted. A price decline isn't only a loss on a chart. It can reduce account equity, trigger forced orders, worsen execution, and alter funding conditions at the same time. Traders comparing derivatives exposure with everyday crypto spending volatility can use this guide to crypto card price-drop volatility, but positions taken with borrowed funds demand a stricter distinction between holding an asset and borrowing against exposure to it.
Bitcoin margin trading is therefore a contest with thresholds. Your job isn't to predict every tick. It's to choose an exposure size and collateral structure that can withstand adverse movement without handing control of the exit to the exchange.
Core Mechanics of Perpetual Futures and Margin
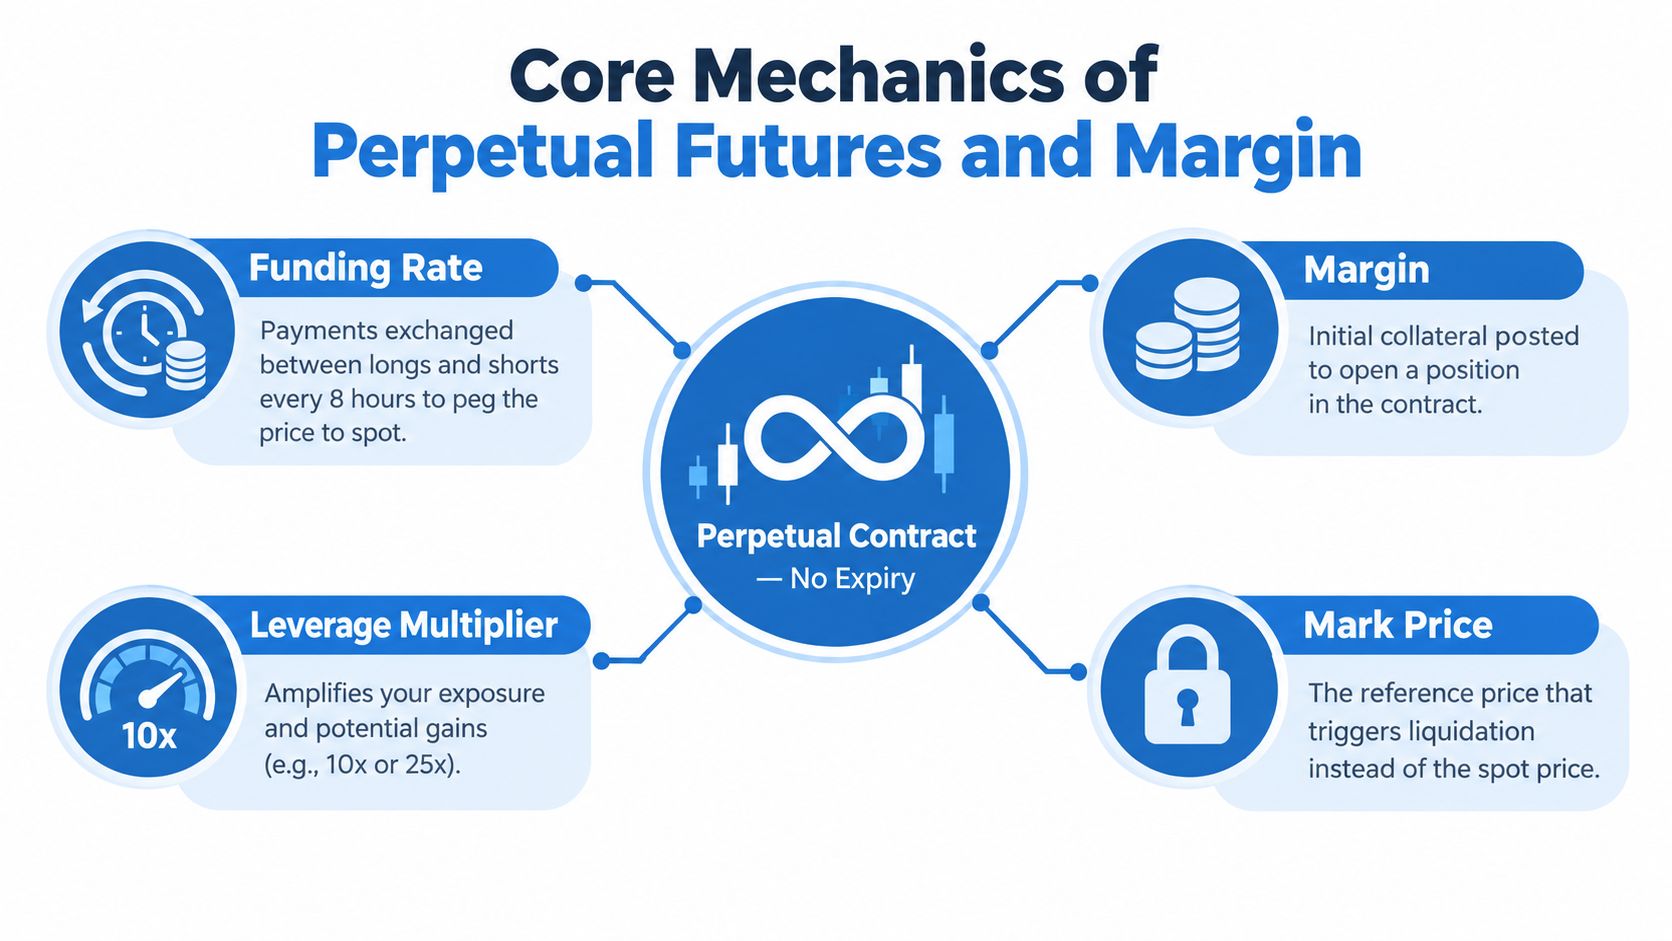
A perpetual future is a derivative contract with no scheduled expiry. Because it never settles by reaching a maturity date, the contract needs a mechanism that keeps its traded price connected to Bitcoin's spot market. That mechanism is the funding rate.
How the position is built
The sequence is straightforward, but each step affects liquidation risk.
You post initial margin. This collateral supports a position whose notional value is larger than the cash you committed. The term refers to the relationship between that exposure and your margin, not a guarantee of return.
The exchange marks the position continuously. Unrealized profit and loss changes as the reference price changes. A position can lose equity even while the trader has done nothing manually.
Maintenance margin becomes the hard boundary. This is the minimum equity the exchange requires to keep the position open. If equity falls below it, the exchange can begin forced closure.
Funding transfers between traders. When perpetual futures trade above spot, a condition known as contango, longs pay shorts. When they trade below spot, or in backwardation, shorts pay longs. The payment transfers help pull the contract toward the underlying market.
The mark price matters more than a single spot print. Exchanges generally use a reference price designed to reduce the effect of isolated trades or temporary wicks. The exact calculation varies by venue, so the liquidation estimate shown on the order screen deserves close attention.
Cross margin and isolated margin
Isolated margin assigns a defined collateral balance to one position. If that position is liquidated, the loss is generally contained within the amount assigned to it, subject to the venue's rules and execution conditions. It doesn't make the trade safe, but it prevents one position from automatically sharing the entire account's available collateral.
Cross margin treats eligible account collateral as a shared pool. That can give a losing position more room before liquidation, but the additional room comes from the rest of the account. A single bad trade can therefore consume capital that the trader thought belonged to other positions.
The difference is a risk-allocation decision, not merely a user-interface preference. Cross margin may be appropriate for a deliberately managed portfolio, while isolated margin makes the maximum intended loss easier to define. Neither mode protects a trader from a gap, thin liquidity, fees, or a position that was oversized from the start.
What the exchange is monitoring
The exchange continually compares account equity with maintenance requirements. Equity includes the effect of unrealized price changes and may also reflect funding and trading costs. As the buffer narrows, liquidation becomes a market-execution problem rather than a prediction problem.
A position can look manageable on a candle chart while being fragile at the account level. Before opening it, check the notional exposure, collateral assigned, estimated liquidation price, maintenance requirement, funding direction, and the consequences of adding another position under the chosen margin mode.
The Nonlinear Math of Forced Liquidations
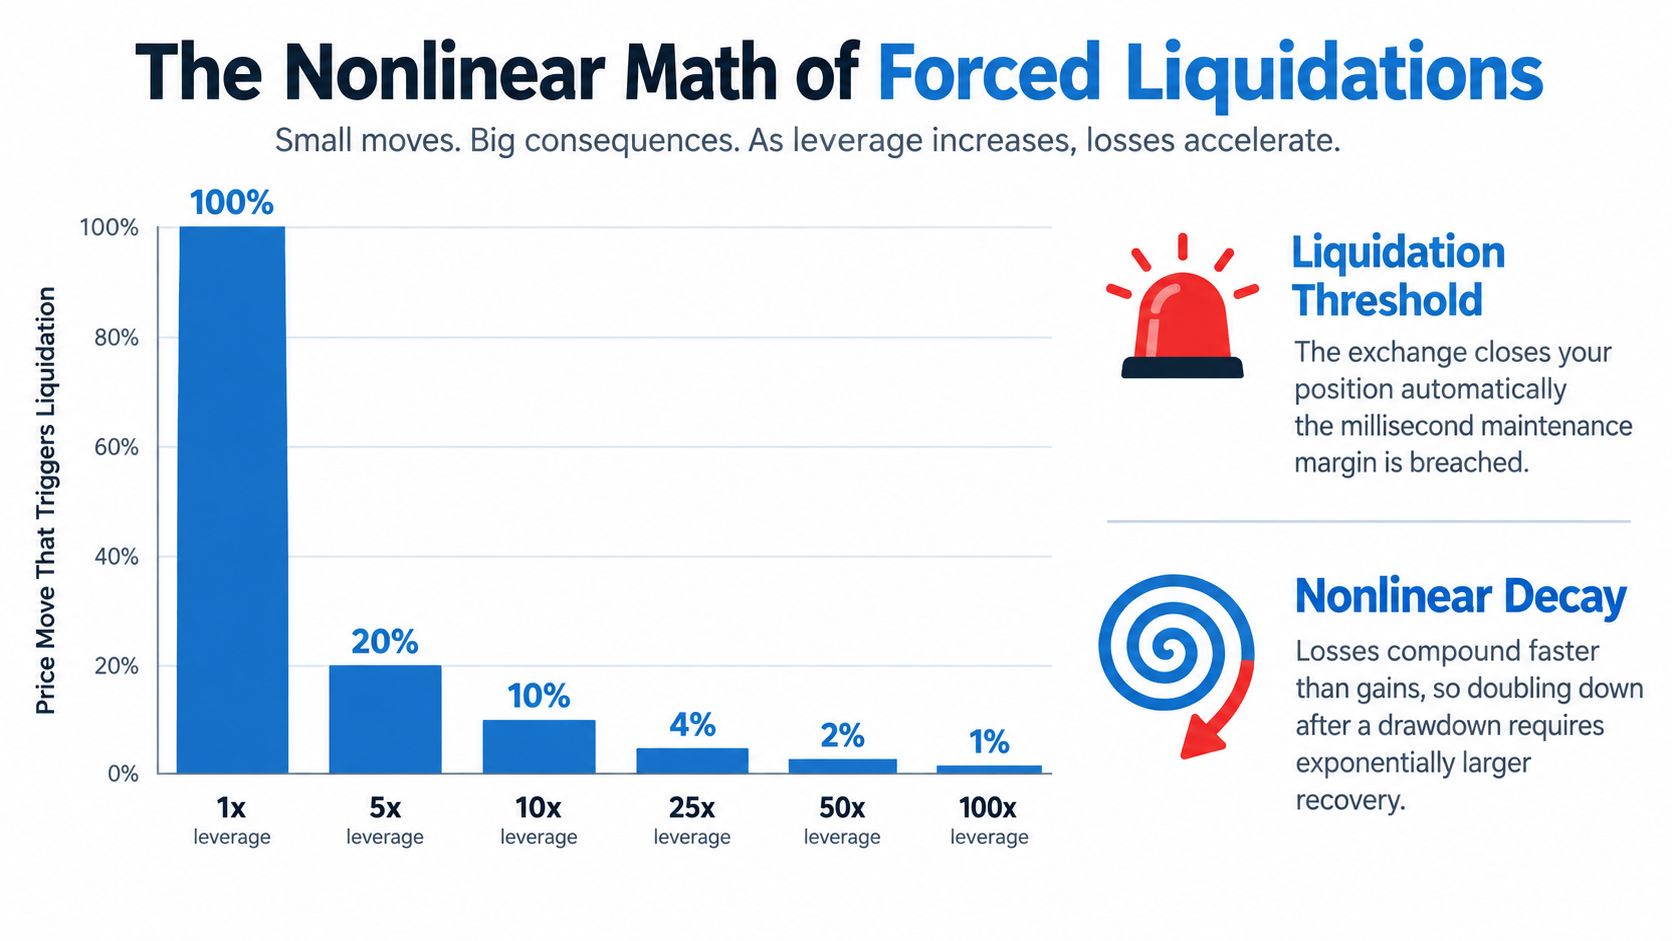
Liquidation doesn't occur because a position is temporarily underwater. It occurs when the account's margin equity falls below the exchange's maintenance margin, which makes the process nonlinear. Losses reduce the collateral supporting the position, and the remaining collateral must support the same exposure until the exchange intervenes.
An empirical study of perpetual Bitcoin futures on BitMEX found daily forced liquidations equal to 3.51% of outstanding futures overall, with 1.89% for longs and 1.89% for shorts, according to the study of BitMEX perpetual futures. The same research found that traders forced out used average leverage near 60x. Those figures don't describe every venue or every market regime, but they expose the gap between the advertised maximum and the profile associated with actual forced exits.
Why the threshold arrives quickly
At a simplified level, a position with high gearing has little equity relative to its notional exposure. A small adverse move therefore consumes a large share of the posted margin. The liquidation price also depends on maintenance requirements, fees, funding, contract design, and the exchange's mark-price methodology, so a neat reciprocal formula is only an intuition, not a trading plan.
The key point is that this financing compresses the error budget. At modest levels of margin, the position may tolerate ordinary noise. At extreme levels of margin, ordinary noise can become a margin event before the trader has time to adjust.
This is why “I only need a small move in my favor” is incomplete reasoning. The same sensitivity that makes a small favorable move appear attractive makes a small adverse move capable of ending the trade. Once liquidation begins, the trader no longer chooses whether to reduce exposure, when to place the order, or how much liquidity will be available.
What margin requirements are trying to control
The BitMEX research estimated that reducing the daily probability of a margin call to 1% would have required much larger buffers than the then-standard 1% margin. Its estimates were approximately 33% margin for long positions, corresponding to about 3x exposure, and 20% for shorts, corresponding to about 5x exposure. These estimates are specific to the study's setting and shouldn't be treated as a universal exchange rule, but they illustrate the defensive logic behind lower exposure.
Maintenance margin protects the exchange's ability to close a position before collateral is fully exhausted. It also protects the market from an account whose losses exceed its available equity. Traders who use the maximum allowed by a venue aren't merely accepting more volatility. They're operating close to a forced decision made by the risk engine.
The liquidation price is not where your analysis ends. It's where the exchange takes over.
Funding Rates as a Live Market Signal
Funding is often treated as a small holding cost. That understates its importance. In perpetual futures, funding shows which side is paying to maintain directional exposure and can reveal when borrowing has become crowded.
When the futures contract trades above spot, longs pay shorts. When it trades below spot, shorts pay longs. The transfer helps anchor the perpetual contract, but it also changes the economics of holding a position. A long can be right about Bitcoin's broad direction and still underperform because repeated funding payments reduce the position's net return.
A recent risk analysis found that cumulative funding rates, open-interest changes, and realized volatility were significant predictors of extreme BTC price crashes of at least 5% within 8 hours, as reported in the leverage-risk study. The implication is more useful than the statistic alone. Funding isn't only a fee. Together with open interest and volatility, it can identify a market where directional exposure is becoming vulnerable to forced unwinding.
Reading the carry
A positive funding rate means longs pay shorts under the stated mechanism. A negative rate reverses the transfer. The trader should therefore ask two separate questions:
- Is the position directionally correct?
- Is the position expensive to maintain while waiting?
Recent market data reported a median positive funding rate of 0.00594% per settlement period across 25 major markets, while a funding-rate dashboard tracks the direction across venues. The figure is tied to the referenced analysis and settlement context. It isn't a universal rate, and it can change with positioning.
| Market Condition | Funding Rate Direction | Impact on Longs | Impact on Shorts |
|---|---|---|---|
| Futures above spot | Positive | Longs pay funding | Shorts receive funding |
| Futures below spot | Negative | Longs receive funding | Shorts pay funding |
| Funding near neutral | Limited transfer | Carry has less influence | Carry has less influence |
| Persistent positive funding | Longs continue paying | Return faces ongoing drag | Short carry improves, subject to price risk |
Funding becomes especially dangerous when traders repeatedly rebuild borrowed exposure after a liquidation event. The position may be reopened with the same directional bias, while the carry cost continues to erode equity and the market remains vulnerable to another unwind. A rising price therefore doesn't automatically validate a long strategy built on borrowed funds. Price return, funding drag, fees, and liquidation risk must be measured together.
The practical signal is the combination. Positive funding alone isn't a sell signal. Positive funding with expanding open interest and rising realized volatility is more concerning because it suggests that more capital is committed to the crowded side while the market is becoming less stable.
Anatomy of a Liquidation Cascade
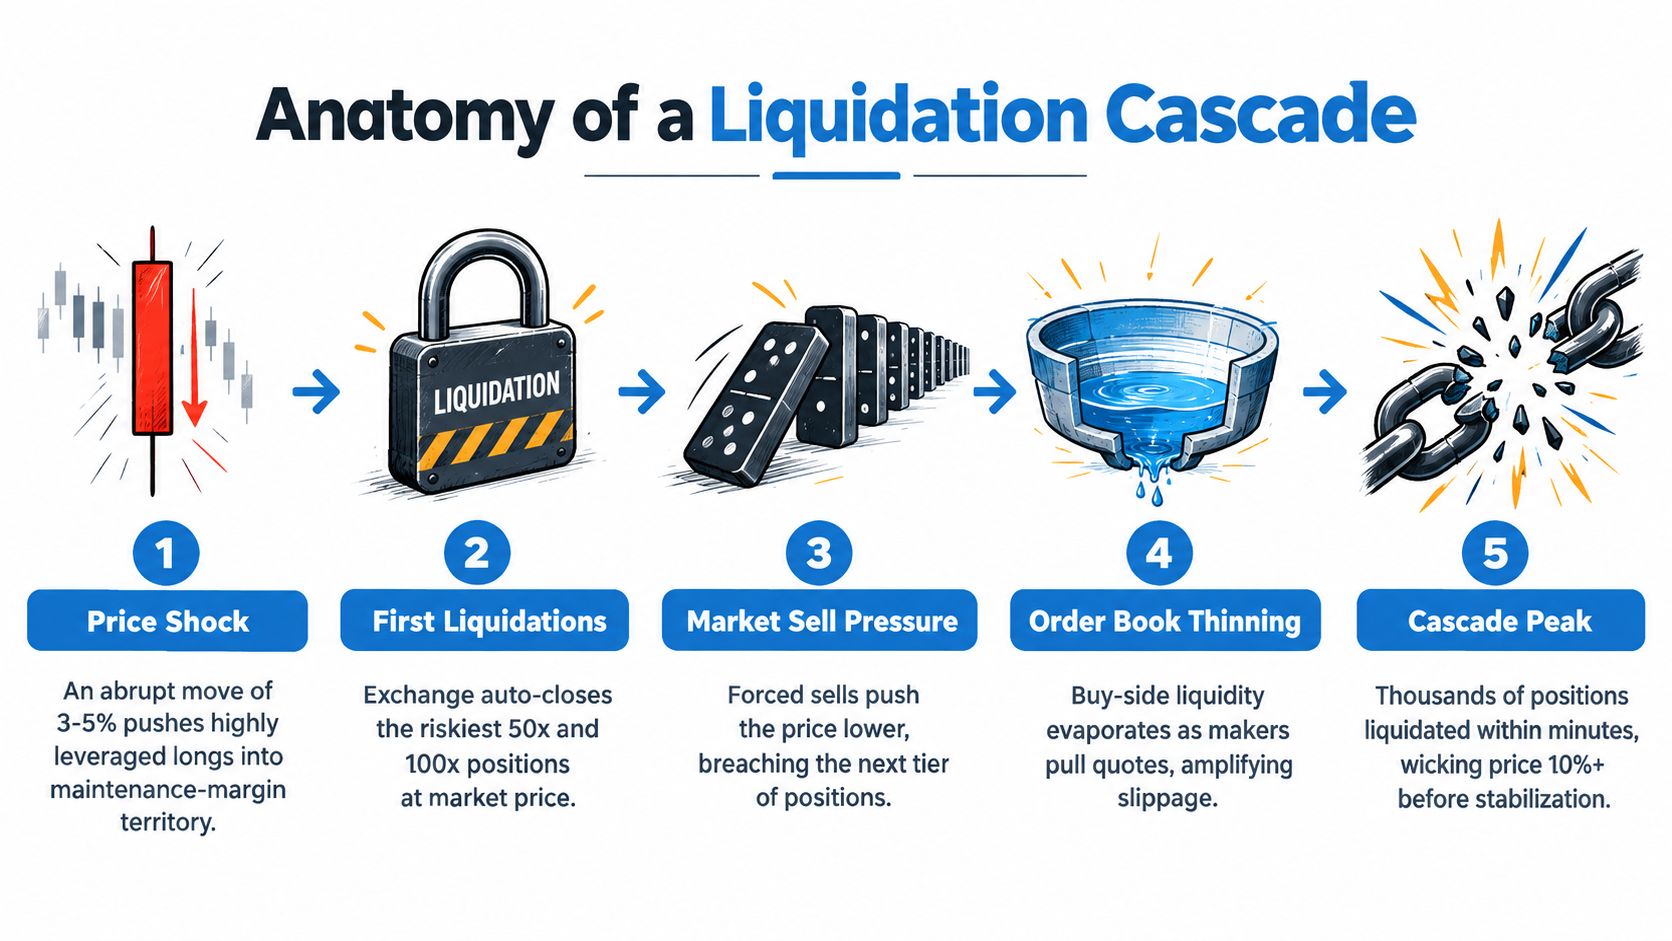
A liquidation cascade begins with a price move that may look ordinary in the spot market. The damage accelerates because amplified positions convert that move into forced orders, and those orders alter the market price seen by the next group of traders.
Consider a market crowded with longs held on borrowed funds. A spot decline reduces the mark-to-market equity of the most fragile accounts first. The exchange closes those positions, usually by sending orders into available liquidity. Those sales add pressure to the market, which can push the mark price into the liquidation range of positions built with more moderate borrowed exposure.
The chain reaction
Initial price shock. A decline reduces collateral value and narrows the buffer for highly [removed] longs.
First forced closures. The risk engine closes accounts whose equity no longer satisfies maintenance margin. The affected traders aren't choosing a patient exit.
Additional selling. Forced closing orders consume bids and can worsen execution, especially when liquidity thins.
The next thresholds break. Lower prices bring another group of positions below its maintenance requirement.
Feedback overtakes discretion. More liquidations produce more selling, while traders who would normally provide liquidity may reduce their quotes during unstable conditions.
The result isn't a simple sequence of independent losses. Each forced exit can become part of the price input that triggers another exit. That's why the relevant risk measure is not just the distance from entry to liquidation. It's the density of liquidation levels around the current market and the amount of open interest that could be forced through them.
A June 2026 crypto selloff triggered more than $1.1 billion in liquidations within 24 hours, including $945 million from longs, according to market coverage of the event. The same verified reporting describes other 2026 windows in which hundreds of millions were wiped out within a few hours. These figures demonstrate cascade scale, but they don't imply that every selloff becomes a cascade.
A cascade is a liquidity event as much as a price event. The forced order is part of the mechanism that changes the price.
For traders, the warning signs are crowded directional positioning, high open interest, persistent one-sided funding, and thinning order-book liquidity. None predicts the exact trigger. Together, they describe a market where a small initial move has a greater chance of becoming self-reinforcing.
The following video can help visualize the sequence of forced closing and feedback:
Risk controls should be designed before the chain begins. A trader looking for a practical framework on protecting capital from liquidation events should focus on position size, collateral isolation, and exits placed well before the exchange's own threshold.
The Structural Shift in Crypto Derivatives
Bitcoin derivatives are no longer defined by one instrument or one type of trader. Perpetual futures remain central to crypto market structure, but options have expanded the range of ways traders can express risk, hedge exposure, and define downside.
Recent market data dashboards show aggregate Bitcoin open interest around $57.24 billion and worldwide 24-hour liquidations of $112.84 million across derivatives venues, according to Bitcoin derivatives market data. Those figures describe a market with substantial outstanding exposure and meaningful turnover in forced exits. They shouldn't be read as a forecast, because open interest alone doesn't identify direction or liquidation proximity.
A 2026 analysis of crypto derivatives reported that offshore Bitcoin futures volume had fallen about 97% from its 2021 level, while options grew from roughly one-quarter to nearly half of crypto-native Bitcoin derivatives open interest, as described in the same market reference. The structural message is clear: classic futures no longer represent the entire risk-transfer picture.
Futures and options solve different problems
Perpetual futures offer direct, continuous directional exposure. Their strengths are also their hazards. The position has no expiry, but it carries funding, depends on margin maintenance, and can be forcibly closed when collateral falls short.
Options can provide a different form of amplified exposure because the buyer's maximum loss is defined by the premium paid, while the seller takes on a different and potentially substantial risk profile. Options don't eliminate complexity. Volatility, time decay, liquidity, strike selection, and settlement terms all matter. They move some risk away from the perpetual-futures liquidation mechanism.
The shift toward options also changes how traders should assess venue quality. Liquidity may be distributed across offshore futures, options markets, and more regulated products rather than concentrated in one perpetual contract. That makes instrument selection part of risk management, not just a question of preferred interface.
The market still contains plenty of leverage, but the form of that borrowing is changing. A trader studying broader market cycles can consult this Bitcoin crash forecast and Benner cycle guide, while keeping the distinction clear: a macro framework doesn't replace a margin model. The instrument determines how a forecast can fail.
Defensive Risk Management and Position Sizing
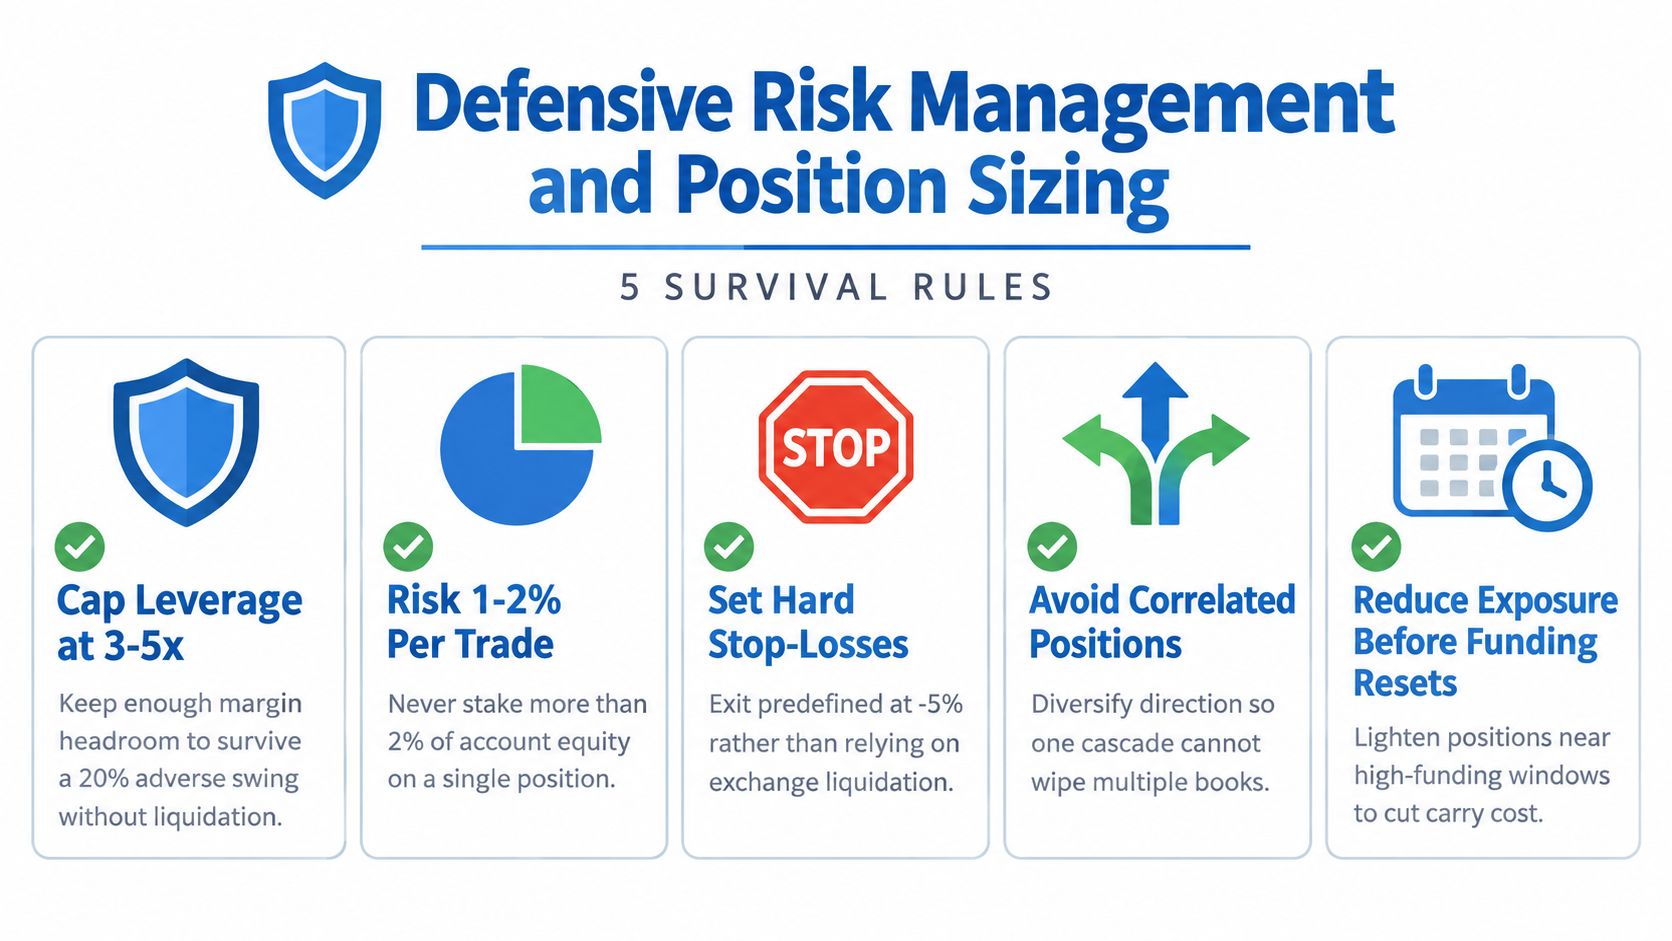
Survival begins with a decision made before the order is placed: how much of the account can be exposed to a forced exit? The answer should come from acceptable loss, not from the maximum borrowing power displayed by the exchange.
Position sizing needs to incorporate the whole cost stack. Estimate the loss at your hard stop, add expected fees and funding, then compare that total with account equity. If the trade only works when funding stays favorable, execution is perfect, and liquidation never approaches, the position isn't built to withstand adverse conditions.
A defensive operating protocol
Size from the stop, not the headline exposure. Choose the price where your thesis is invalidated, then reduce notional exposure until that loss is acceptable.
Keep liquidation distant from the planned exit. A stop-loss should give you control before the exchange's maintenance engine does. A stop isn't guaranteed during a fast market, but relying on liquidation guarantees poor control.
Use isolated margin when you need a defined compartment. This prevents a single position from automatically drawing on the whole account under cross-margin rules, though it doesn't remove execution or gap risk.
Treat funding as part of the thesis. If a long requires extended holding time while positive funding persists, calculate whether the expected price move can overcome the carry drag.
Monitor the market's structure, not just your position. Open interest, funding direction, realized volatility, and nearby liquidation concentrations can reveal whether a trade is entering a crowded environment.
The BitMEX evidence gives a useful scale for this defensive mindset. Its analysis estimated that a 1% daily margin-call probability would have required roughly 3x position sizing for longs and 5x for shorts under its assumptions, rather than the very high position sizing promoted by some venues. That doesn't establish a universal safe setting. It shows why lower position sizing creates room for ordinary market movement and why the exchange's maximum is a poor proxy for sensible sizing.
Before trading, review the venue's margin schedule, mark-price rules, liquidation process, funding interval, and insurance or loss-sharing provisions. Traders comparing exchange infrastructure and available products can use exchange data from NomadCards as one research input, then verify the current terms directly with the venue.
Bitcoin margin trading rewards restraint more reliably than aggression. If you can't explain how funding, maintenance margin, collateral mode, and cascade risk affect the position, the trade isn't ready to be opened.
NomadCards compares crypto-linked debit and credit cards by normalizing fees, rewards, supported assets, custody model, KYC requirements, networks, and regional availability. Visit NomadCards to evaluate spending and financing tools separately from margin trading, so market exposure doesn't become the only way you access liquidity.